14 Dec 2011
Spatial variability of soil fertility parameters
A. Tsyrulev

In this region of Russia, routine soil sampling for agrochemical analysis is done manually and, most importantly, without precise reference of sampling points to a map. Thus, during the next soil sampling it is not possible to claim with confidence that soil samples are taken from the same place. Such an approach makes it difficult to characterize the status and dynamics of soil fertility changes in the field that are needed for fine tuning of fertilizer application rates. This negatively affects both the economics of agricultural production and the environment (Yakushev, 2002).
The Ministry of Agriculture and Food of Samara Oblast initiated and supported a special research project to test a new method of discrete soil sampling for soil fertility survey using GIS and GPS navigation systems. The research work was conducted on fields of the agricultural enterprise Samara-Solana in Stavropol District of Samara Oblast. Common chernozem is a predominant soil type of the area. The variability of four soil fertility factors, including organic matter (humus) content, available P and K... extraction with 1% (NH4)2CO3... and soil pH, was measured in 2007 in 10 fields totalling 776 ha.
Soil sampling was done by an automatic mobile complex that included a navigation system with built-in high-precision GPS receiver, field computer with special software, and automatic soil sampler (Figure 1). Fields were divided into basic soil sampling areas of 4 ha (200 m x 200 m) and the automatic soil sampler, moving diagonally, took 10 soil samples (0 to 30 cm depth) from each basic area. These 10 soil samples were mixed and one soil sample was prepared for the basic area and then used in soil fertility tests (with the traditional approach, one mixed soil sample is taken from the area of 25 to 40 ha). As a result, selected fields, depending on field acreage, were characterized by 10 to 30 soil samples (number of observations).
Table 1 shows results of soil fertility analysis of the agricultural enterprise’s fields, including mean, confidence interval, coefficient of variation, and number of samples used in the analysis. According to these data, available P and K content in the soil were found to be the most variable parameters. The coefficients of variation for available P ranged from 16% to 51% and for available K, from 18% to 37%. Soil humus content had medium variability (7 to 15%), and the lowest variability was revealed for soil pH (2 to 5%). Thus, this study indicated considerable variability in soil fertility characteristics of chernozemic soil, particularly for available P and K, even on leveled fields of this advanced agricultural enterprise. Variable rate fertilizer application, hence, should be considered as an important method for making soil fertility distribution more uniform. According to recent estimates, variable rate fertilizer application in current economic conditions in Russia may be reasonable if spatial variability in the content of soil nutrients is about 20% or more (Afanasyev, 2010).
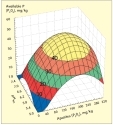
Using GIS software, soil fertility properties from the basic areas were interpolated to the whole field, to reveal the spatial heterogeneity of soil nutrients and create spatial distribution maps showing zones with the same level of nutrient content (Figure 2). In this study, final maps indicate 20 zones (the number of zones is adjusted) over the field for each soil parameter. Such a detailed mapping of soil nutrient content is required for calculating fertilizer application rates for soil
management zones with different fertility status. Calculation of fertilizer rate based on expected crop yield is done using software with a built-in equation editor, taking into consideration soil nutrient content of basic areas. Fertilizer variable rate application maps were developed for each basic area over the field, but soil management zones have a square form sized according to the coverage of a variable rate fertilizer spreader (polygons converted to blocks).
A short-term, on-farm research experiment was conducted in the same agricultural enterprise to investigate the benefits of variable rate fertilizer application to spring wheat based on measurement of spatial variability in available P and K content in the soil (Tsirulev, 2008). The experiment consisted of five treatments: 1) extensive crop management approach without fertilizer use (control), 2) ordinary technology (average fertilizer practice, without soil testing), 3) ordinary technology with GPS navigation (to monitor and control agricultural machinery operations in the field), 4) intensive technology (fertilizer rates calculated using the balance method based on expected wheat yield and the average available P and K content in the soil measured with the traditional soil sampling procedure), 5) intensive technology with GPS navigation and variable rate fertilizer application.
Net profit was highest for the 5th treatment (3,638 RUB/ha) where precision agriculture approaches were used, and exceeded by 11% the net profit for the 4th treatment (3,264 RUB/ha) when fertilizer rates were calculated using the balance method based on the average available P and K content in the soil (Figure 3). The measurement of spatial variability in available P and K indicated areas with high or very high levels for both nutrients, which for the 5th treatment did not require P and K fertilizer application according to the standard soil fertility classes. Thus, fertilizer expenses decreased by 9% (from 1,552 to 1,411 RUB/ha) compared to the 4th treatment where fertilizer rates were calculated by the balance method based on the analysis of a mixed soil sample from a large area.
It may be concluded, therefore, that measurement of the spatial heterogeneity of soil fertility factors enabled more precise agrochemical analysis of arable fields compared to the routine approach widely used in soil fertility surveys. Variable rate fertilizer application, moreover, considerably increased the efficiency of mineral fertilizer use. It is important to note that the application of fertilizers at average rates based on the traditional soil sampling method may result in both under- and over-fertilization on some parts of the field. The latter factor may have a negative impact on the environment.